IUCN/SSC Otter Specialist Group Bulletin

|
©IUCN/SCC Otter Specialist Group Volume 30 Issue 1 (January 2013) Citation: Grogan, A., Green, R., and Rushton, S. (2013). The Impacts of Roads on Eurasian Otters (Lutra lutra). IUCN Otter Spec. Group Bull. 30 (1): 44 - 57 The Impacts of Roads on Eurasian Otters (Lutra lutra) Based on a presentation at: The Mammal Society Autumn Symposium 2003. Mammals and Roads Adam Grogan1, Rosemary Green and Steve Rushton 2
1RSPCA Wildlife Department, Wilberforce Way, Southwater, West Sussex, RH13 0AE, UK. |

 |
| Received 10th June 2013, accepted 16th June 2013 |
| Abstract: The Eurasian otter (Lutra lutra) has made a dramatic and very welcome recovery to many of the river systems within the UK, following its decline in the 1950s. This new expanding otter population is now seen to be under a threat from a range of anthropogenic causes and one such threat could be the increasing number of otter road casualties found on an ever expanding road network. Although roads kill many tens of otters in this country each year, evidence of otters recolonising new areas would imply that road casualties do not negatively affect the otter population as a whole. Road casualty otters are presumed to be highly visible and many are collected and submitted for post mortem. This data reveals a great deal about these otters but some animals may not be examined, and others missed entirely, due to non-recognition or complete destruction of the carcass by road traffic. Furthermore, data from road traffic casualties may be mis-leading in terms of population dynamics. This paper discusses what impacts these casualties may actually have on the population of otters in the UK. This paper was originally presented at the Mammal Society’s Roads and Mammals Symposium, held at the Zoological Society of London in November 2003. |
| Keywords: road-kills, casualties, population-recovery, population-models, road traffic accident, RTA |
| Française | Español |
INTRODUCTION
The publication of the 4th Otter Survey of England (Crawford, 2003) has confirmed that the Eurasian otter (Lutra lutra) is re-colonising much of its former range in England after the decline in population that started in the 1950s. The otter populations of Wales and Scotland have seen a similar, earlier recovery, (Andrews, Howell and Johnson, 1993; Green and Green, 1997) and increases in the geographical range and density of otter signs have been reported over much of Europe, (Conroy and Chanin, 2002; Kranz et al., 2002; Reuther, 2002).
Despite this widespread success there are fears that this trend could be reversed. One possible threat is road traffic mortality. A review of causes of non-natural otter deaths highlighted this as a considerable and growing threat to otters in Europe nearly two decades ago (Green, 1989). Since then road traffic has been more frequently cited as a major killer of otters throughout Europe. This paper discusses some of the existing studies and considers whether road traffic deaths are of an order likely to affect population growth or survival.
ROAD CASUALTY DATA
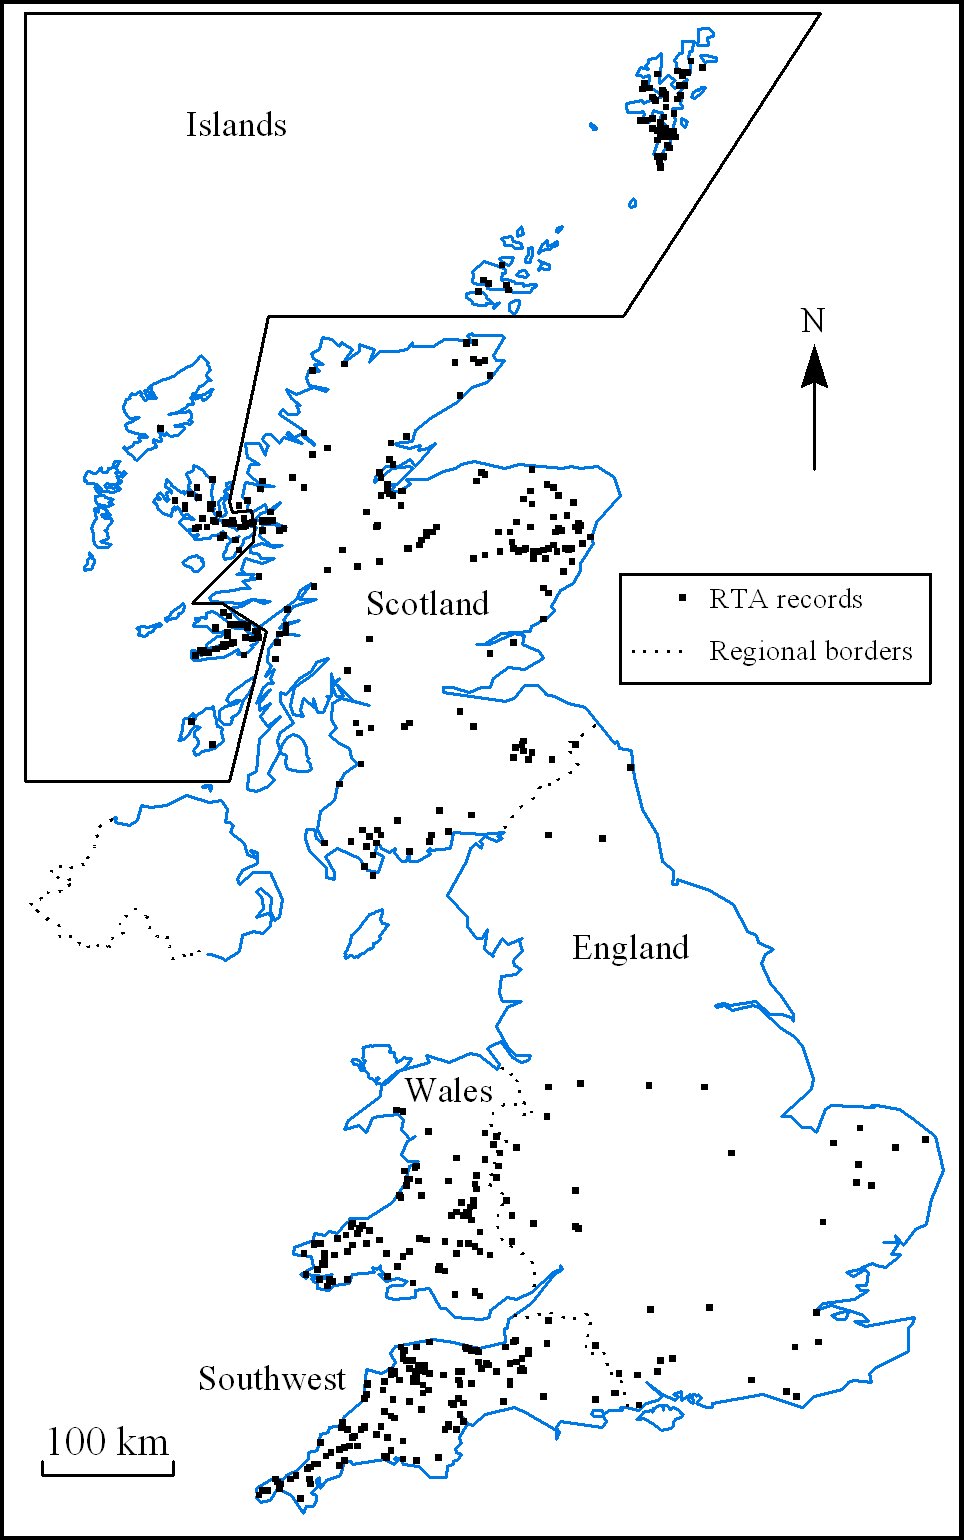
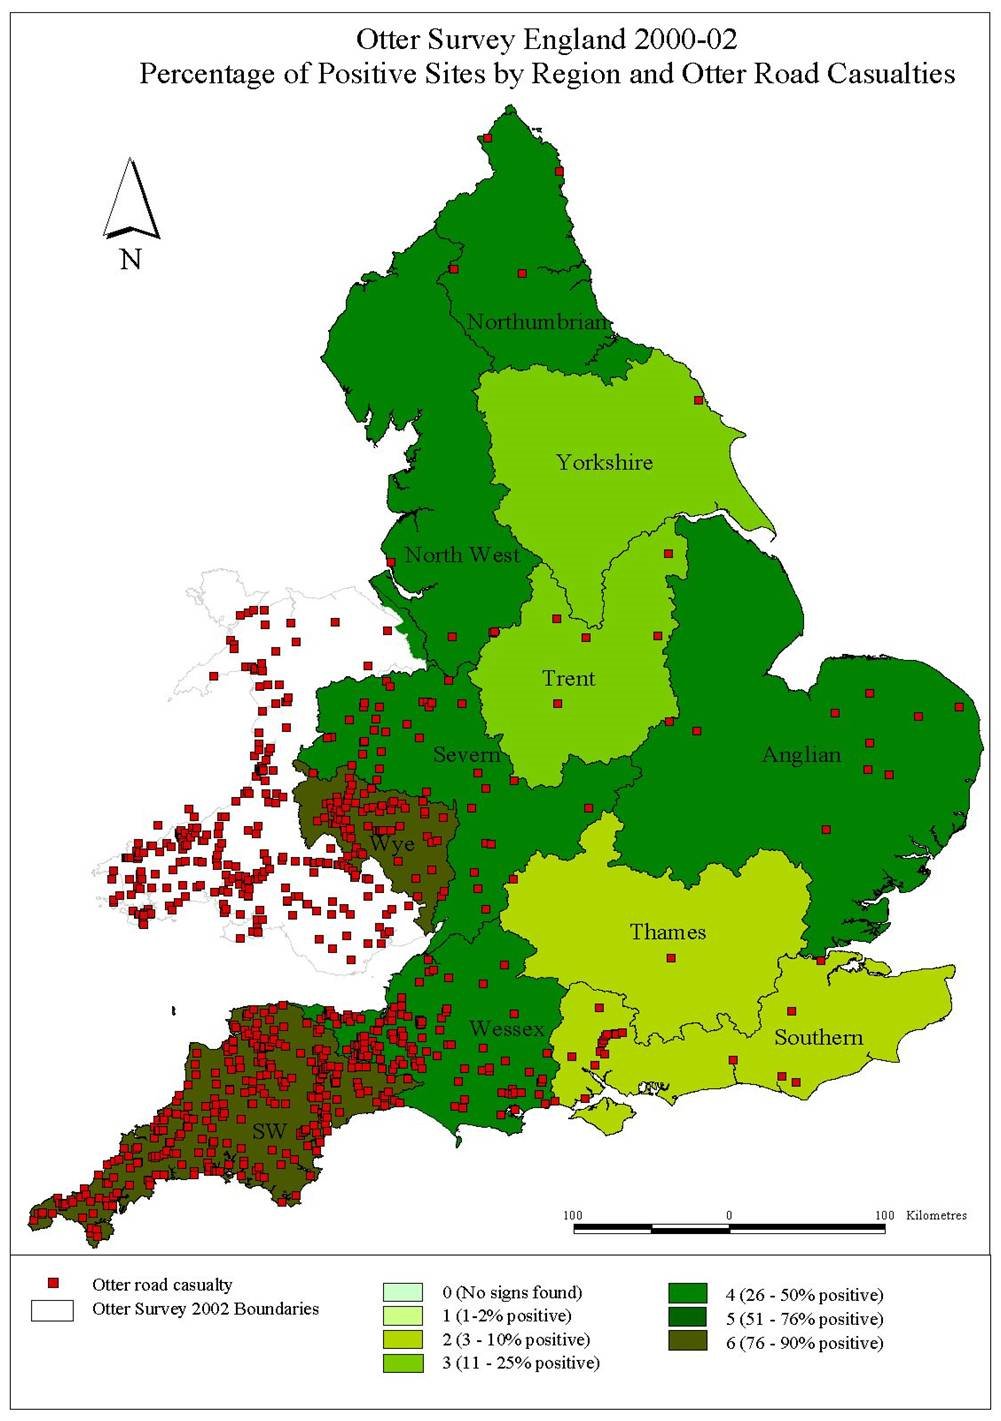
There is evidence that the number of otter road casualties across the UK is increasing. A study funded by the Highways Agency analysed data from 673 otter road casualties from around the UK recorded between 1971 and 1996 (Philcox et al., 1999) (Figure 1). The analysis of these casualties identified particular trends based on season, distance from water, road type and crossing type. Another analysis has since looked at data collected from England and Wales up to 2003 (Figure 2) (Grogan, 2003). What is striking is the increase in road casualties between these two studies, (see Table 1).
 |
 |
|
Figure 1.
The location of casualty records and regions from Philcox et al., 1999 (click for larger version) |
Figure 2.
The location of casualty records for England and Wales to Spring 2003. (click for larger version) |
A database of nearly 2000 Scottish otter road casualties, beginning in 1969, shows a rise from less than 10 records per year in the 1970s (average 3.5) to an average of 46.4 per year in the 1980s and 92 per year in the 1990s. The road with the highest recorded death rate, the A75, has had 356 otter deaths since 1985 and has a five yearly rolling average rising from 4.6 to 24.8 deaths per year.
| Table 1: Numbers of otters killed by road traffic in Southwest England and Wales. | ||
| Southwest England | Wales | |
| 1974-1996 | 147 | 177 |
| 1997-2003 | 341 | 245 |
| Total | 488 | 422 |
European authors (Madsen, 1996; Korbel, 1994; Rosoux and Tournebize, 1995; Heggberget, 1991; Frank et al., 2002) have recorded an increasing toll of otters killed by road traffic in the 1990s, which has continued into the twenty first century (Heggberget, Rosoux, Libois, Madsen, Frank, Kranz, pers.comm.).
RELIABILITY OF DATA
A considerable number of otters are on record as having been killed on roads throughout Europe, but there are a number of factors which make it difficult to compare data or to analyse them. There is no way of knowing how the number of records relates to the number of otters actually killed or whether the distribution of age and sex recorded represents that of the animals killed. In some countries, such as Denmark, there is a mandatory system of sending all corpses and all records to a central institute for analysis, but in Britain there is no such systematic recording. There have been a number of studies funded to collect and analyse corpses and records, but these have all relied on short term and voluntary effort over limited geographical areas. Studies based on animals sent for post mortem examination, or to museums, are biased towards whole bodies, in good condition, which may influence factors such as distribution of age, sex or seasonal records in the sample. Intuitively, it is assumed that studies in parts of England, where otter populations are recovering, where many people are interested in wildlife, there is a strong public awareness of otters and publicity for the study, are likely to collect a higher proportion of the available data than in Scotland, where a dead otter is not particularly noteworthy. A map of the distribution of otter road mortalities in Scotland shows clusters of records which reveal more about the distribution of recorders than of otter deaths.
Within the available samples there is no way of knowing what proportion of the animals hit by vehicles is represented by those found dead on carriageways. Most records come from observers within vehicles, which give a restricted view of the roadside verge and very little beyond that, so it is possible that many more animals are hit, but survive long enough to get clear of the carriageway.
A database which collects records from a number of sources has many inherent problems of reliability. While members of the public may recognise an otter, they may not be accurate on sex, size, or location (and sometimes species). Animals may be reported several times by different people, all giving slightly different locations; unless each can verified it is not possible to tell whether one is dealing with a cluster of deaths or a case of multiple reporting. One otter on the Scottish database was reported six times between November 1995 and the following February, by five different people; it was only because the author (RG) checked it each time that it was known to be a single corpse. Excluding any unverified records, which could be multiple reporting should avoid over recording, but may result in considerable under recording of the true situation.
While all studies appear to show a similar distribution of deaths by season, this may be partly governed by the time of day when traffic is on the road, either killing otters or collecting records of dead otters. In spring and autumn rush hour traffic is around dawn or dusk while in winter the rush hour is after dark and in summer the rush hour is in daylight. Most records come from people travelling the same road regularly. The dip in numbers of records during winter could simply be the result of many recorders travelling in the dark.
A number of factors influence the time a corpse remains recognizable on the carriageway. Small corpses last less time than larger ones, the position on the road influences the time a corpse remains recognizable, corpses last longer in cold, dry weather and least time in hot, wet weather; scavengers or the action of traffic can move a corpse along or off the road, (Green, 2003).
While records of levels of road mortality must be used with care, they are the most readily available source of mortality data and of corpses for autopsy. The relative proportion of road mortality, compared with other causes, is heavily biased by its being by far the most easily observed and recorded.
All of these factors affect the validity of conclusions based on observations of otter road mortality and make it difficult to determine whether road mortality affects the population. Road casualty data cannot be taken as a true sample of the population; it is only representative of some of the otters killed by vehicles. This is not to say that the studies do not have a value in showing trends in mortality, in pinpointing areas where mitigation can usefully be deployed or in testing the effectiveness of mitigation measures.
IMPACT OF ROAD TRAFFIC ON INDIVIDUAL OTTERS
There is no doubt that traffic accidents will affect individual otters and that they are frequently fatal. Of 150 otters sent to a Scottish rehabilitation centre, only 21 had been injured by road traffic, or had injuries consistent with such a cause, of which 12 died or were euthanized and only 4 recovered sufficiently to return to the wild. Over the same time span more than 1000 otters were recorded as being killed by traffic in Scotland.
Autopsies of 67 otters from Scottish roads showed that 10 did not die immediately of their wounds and that 7 had signs of previous collisions with objects hard enough to have broken bones or damaged internal organs, which probably indicated earlier traffic accidents. Some of the animals which died as a result of collisions with vehicles had trauma from earlier bite wounds and some of the animals presenting as victims of intra specific fighting had older wounds from collisions. Simpson (1998) also reports some animals showing signs of earlier traffic accidents. Green and Green (2002) showed that the more impaired an otter is, the greater its chance of incurring another injury. Even if an otter recovers from the injuries cause by a traffic accident it is at increased risk of a subsequent collision, of damage from other otters or disease and therefore less likely to breed successfully.
The welfare implications can extend beyond the fate of the individual otter in such collisions; if a female is killed dependent cubs are unlikely to survive. Family groups have been recorded as casualties all over Scotland, with mother and cubs dying together or the deaths spread over several days. Even if the cubs do not die with their mother, unweaned cubs will starve in the holt and older cubs are likely to die as they depend on their mothers for many months. It is also not uncommon for pairs of sub-adult otters to be killed together.
Data are sparse, but it appears that pregnant females are particularly at risk from road traffic. Out of 164 autopsies 62 (38%) were adult females and of these 14 (23%) were described as heavily pregnant (R. Green, unpublished data) or as having well formed foetuses in utero. Ifthese animals are taken to have been in the second month of their pregnancies (gestation 60-62 days in otters) (Heggberget, 2002) and the breeding cycle is taken to last 14 months from conception to dispersal of offspring, then around 7% of females killed would be expected to be in the second month of pregnancy. This limited sample has more than three times as many such females. Data from the A75 also suggests that lactating females are over represented in the female sample, but numbers are very small.
POTENTIAL IMPACTS ON OTTER POPULATIONS
The impact of road traffic mortality on populations is much harder to assess. There have been many otter surveys throughout Europe, but none of them are designed to give population estimates, so although we know that the geographical range of the species is increasing and we can infer from survey results that population density is increasing, we have no numerical data against which to measure the impact of road mortality. We also have no estimate of the total number of animals killed by road traffic, although it is certainly larger than the data available. The impacts of this cull will also be affected by its geographical distribution, the status of the local otter population, the varying impacts on sex and age classes and the level of other causes of mortality.
Otter road mortality is not evenly distributed, but is affected by local topography as well as the geographical range of the otter population. For otters to be killed on roads they have to be present in the area, but it is not known whether there is a proportional relationship between the level of population shown by surveys and the number of otters killed in the area. The population in a newly recolonised area, or one with a remnant population, may be more severely affected than an established population; it is certainly more vulnerable. The distribution of particular forms of road engineering has a bearing on levels of mortality. The level of mortality varies with road class and traffic volumes, flows and timing. Road traffic mortality does not affect age and sex classes within the otter population equally. Other mortality pressures are not evenly distributed in time or space either and all of these factors interact.
If roads are random killers, unlike predation and disease which target the weak, usually the young and the old (Kruuk and Conroy, 1991), then equal numbers of males and females, (or at least a representation of the true wild ratio) should be killed. However all the studies listed below show a bias towards males in the samples (Table 2). This demonstrates that there must be behavioural traits that make males more vulnerable than females over most of their lifespan. This is possibly due to males ranging further than females and that young males, in particular, have to travel further to establish home ranges (Heggberget, 1991; Philcox et al., 1999). Behaviour is a significant factor; males are less cautious, less afraid of strange things and more inclined to explore (Green, 1989; 2000). The denser an otter population, the more redundant males there will be, so it might be expected that there are more male deaths in well-established populations. Pregnancy and lactation are times of high energy demand and the added stress of caring for hungry, curious and mobile offspring make adult females vulnerable at the most important time of their reproductive lives.
It is interesting that when wild otters have been studied using other methods of data collection, such as fur trapping, there is a bias towards females in the population (Sidorovich, 1991), which is not explained in the casualty data (Ansorge et al., 1997). To try and understand the otter population structure, Ansorge et al. (1997), created a model by extrapolating from otter casualty data. This model shows a bias towards females in all age groups over one year old, with an average lifespan of around 4.7 years (this is higher than shown by Kruuk and Conroy, 1991). This intuitively makes sense; adult females, surviving to this age, would be able to produce 2 or 3 litters in their lifetime, possibly more. This rate of production would be required for an expanding population and could explain the otter’s expansion in the face of an increasing death toll, although the model does have inconsistencies. For instance it indicates that the ratio of males/females killed in their first year is 1:1, while one study of otter carcasses found a ratio of 0.8:1 for this age group (Heggberget, 1991), although the other age groups concur with the model
STUDY OF OTTER MORTALITY ON THE A75
In view of the deficiencies of data listed above, a systematic survey of a single road was undertaken, with the primary aim of obtaining a minimum estimate of the number of otters killed over a known time and distance and of extrapolating from a situation of constant observer effort to one of variable effort to obtain an estimate of total kill.
The A75, a rural trunk road running 156km from the M74 interchange at Gretna to the ferry ports on Loch Ryan in southwest Scotland was chosen. The area has a human population density of 23.2/square km. The road runs east to west along the north shore of the Solway Firth, never more than 20km from the sea. Because the drainage pattern is north/south the road crosses every major and most minor water courses. Traffic flows are dominated by the Northern Ireland ferries plying out of Loch Ryan with convoys of heavy freight vehicles at night, however despite the ferry traffic, overall traffic levels are low. The average volume of traffic on British rural trunk roads is 15,600 per day, whereas the A75 has around 8,000 vehicles on the busiest stretches and only 4,300 in quieter parts.
The A75 also had a substantial number of detailed records of otter road mortality dating from 1985 and has had fairly consistent observer effort for 18 years. There have been fluctuations in mortality levels from year to year, but five yearly rolling averages for the A75 show a depressing upward trend set against a constant high level of otter population.
Data from the Scottish Executive shows that traffic on the A75 has been increasing over winter months and decreasing in summer, but has still remained reasonably constant between 1996 and 2002 (Scottish Executive, 1998 – 2003).
Every month from July 1996 to June 1997 the road was driven in both directions in the second and fourth week, at a steady 45pmh, unless traffic conditions or speed limits dictated a slower speed. All corpses and locations were recorded on a voice-operated tape recorder and otters, badgers or remains, which could possibly be of these species, were checked on foot, aged, sexed and accurately located. The condition of both new corpses and any remaining from previous drives were noted to assess survival rate of bodies of different sizes and in different parts of the road. Colleagues using the road were apprised of the study and asked to pass on data to assess the scale of multiple reporting. When the drives were completed all mortality sites on the A75 was visited and the vicinity checked, measured and described.
Before the study started 103 otter deaths had been recorded from February 1985 to June 1996 on the A75. Thirty eight dead otters were seen on 24 drives, a further 12 were recorded by the author or others during the time span of the study, but had disappeared by the next drive, and 10 were recorded up to the end of 1997. Despite publicity only one death recorded on the regular drives was independently reported. The total recorded death rate was 50 otters over 156 km and one year. Since 1990 the A75 has had an average recorded death rate of 20 per year with a maximum of 41 in 1996 of which 24 were recorded during the study. The highest yearly total, apart from the study was 35 in 2001. Total recorded deaths on the A75 currently stand at 356.
Drives at two weekly intervals were not adequate to pick up all deaths, but, by analysing survival of corpses it was estimated that around 14 may have been missed, (Green, 2003). The extra twelve records collected are therefore considered to bring the results close to the total of animals killed. Comparison with death rates recorded on the A75 in other years show that the year chosen had not an abnormally high number of deaths. Similarly the authors have noted that the variation in recorded death rates on other trunk roads appears to be largely accounted for by the differences in observer effort
The A75 had one death/3.12km/year over the study period, which was estimated to be close to the total kill. If otter deaths occurred at the same rate on all of Scotland’s 53,000 km road network, the total death rate would be around 17,000. However otters are not killed at the same rate on all road classes. Extrapolating from the rate on the A75, the other 2793km of trunk roads in Scotland would be expected to have a yearly death rate of 895 otters. Otter deaths on trunk roads, other than the A75 amount to 439, or 24.7% of the total database so if 895 equals 24.7% of the total kill, 100% would be 3623, plus the 50 from the A75, giving an estimate of 3673 otter killed each year on Scotland’s roads.
There is little systematic data from mainland roads to check the validity of this estimate, however comparison with data from other Scottish roads suggests that it is in the right order of magnitude (Green, 2003)
What does this mean in population terms for Scottish otters? Harris et al. 1995 estimated the Scottish otter population at 6,600 +/- 3,300 adults (class 3 population estimate). Using this method and the results of the most recent published survey of Scotland (Green and Green, 1997) gives us a figure of between 8 and 10,000 (4,800 – 7,200 on the mainland and 3,000 on the Islands). The adult death rate (31) on the A75 gives a ratio of one death/5.03km/year which would give a figure of 555 adults killed on trunk roads and an annual rate of 2,279 adult otters killed in Scotland. Alternatively, the percentage of adults on the national database (75.4%) can be used with the estimated total death rate, to give a figure of 2,771 adults killed per year.
Taking an estimated population size of around 9,000 otters (mid-point of the estimate), the annual adult death would be 25 to 30 percent of the population. The impact of a cull of this size depends on the levels of other external pressures and also on how the mortality is distributed geographically and among sex and age groups within the otter population. Analysis of deaths on the A75 suggests that road mortality bears more heavily on adult males and young animals than has been reported before, and therefore the estimate of a 25% adult death rate is considered more probable. It is worth noting that this is similar to estimates of adult deaths from road traffic in British badgers (Harris et al., 1995).
MODELLING THE IMPACT OF ROAD TRAFFIC ACCIDENTS ON THE SCOTTISH OTTER POPULATION
One method of determining if such high rates of culling could be affecting the species at a population level is to build a model, using the available data and extrapolating to see if it has any effect. To do this, a Leslie matrix model was used. The population was split into 13 age classes and mortality and fecundity data were derived from the literature (e.g. Kruuk and Conroy, 1991). The RTA mortality data was taken from the A75 study as described above and the starting population was estimated at 8,000 animals.
For this study, a sensitivity analysis (Figure 3) was undertaken, varying the parameters of the regression relating mortality to age (Kruuk and Conroy, 1991), fecundity and RTA mortality. A General Linear Model was used to investigate contribution of each parameter to population size at year 10. To assess the impacts of RTA mortality on population, average demographic parameters were used in the model, such as average age, birth and death rates as derived from Kruuk and Conroy (1991) with RTA mortality varied between 0 and 40%.
IMPACTS OF RTA ON POPULATION SIZE
The model indicates that with a population of 8,000, RTA mortality in excess of 15% can reduce populations of otters, but this model does not take into account evidence that suggests that only the very old and the very young are the main subjects of RTA mortality. Therefore the model was re-run with an emphasis on RTAs mainly impacting on juveniles and animals greater than five years old.
This revised model suggests that if mortality is concentrated in these two age classes then there is less impact on the population as a whole. Therefore it seems likely that otter populations can tolerate reasonable levels of road casualties provided that it is the non-productive age classes that are killed.
Road Casualties in the Southwest
The study of the A75 has addressed the problems of data collection by standardising collection effort on a road where speed and traffic density could be measured and accounted for. This in turn could be representative for Scotland, where there are many kilometres of trunk road similar to the A75. But how representative would this be in England? As there has not been a systematic study of road casualties in England like the study described above it is difficult to compare, although there are similarities. For instance, where the Scottish database records 24.7% on trunk roads, 27.6% are killed on trunk roads in Southwest England. But the distribution of trunk roads vary, so that in Cornwall trunk roads account for 40% of road casualties, but Cornwall has a lower percentage of kilometres of trunk road as part of its road network.
Table 4 emphasises the differences. The A75 study demonstrated a death rate of one casualty per 3.12 km of road a year. Trunk roads in Cornwall show a rate of one casualty per 24.18 km a year. This demonstrates the difficulties with the data. The percentage positive sites from Cornwall and Scotland are both reasonably high. So should we expect a similar casualty rate from two such different areas? In Scotland, most deaths could be divided into those largely influenced by topography, those influenced by road engineering and those resulting mostly from otter behaviour. Some were affected by more than one feature. If a certain design of culvert is installed in a certain sort of habitat the result will definitely be road casualty otters. For others, behaviour and topography or engineering feature interacted fatally.
EFFECTS ON POPULATIONS
There is already good evidence to demonstrate that the otter population in the UK is expanding, but as discussed earlier, the difficulty lies in knowing the size of the population and whether it is increasing, stable or decreasing. The otter surveys may give an indication of density as it is possible to extrapolate a number of otters using data from these surveys. Harris et al. (1995) suggested that there were 350 adult otters in England with 196 in the Southwest. Using the same calculation as Harris et al. (1995), but with data from the most recent survey gives us figures of 1634 and 373, respectively. With 78 road casualties in SW England in 2002, this equates to 20% of the population, which is less than that for Scotland, using the same technique. Of course it should be remembered that this is for recorded otter casualties only and that there is a bias in terms of recorder effort. As the figures for Scotland are based on a systematic survey of one particular road, then a similar survey in Cornwall could highlight the disparity between the perceived and actual road kill.
It is understandable that an increasing otter population would lead to more deaths on the road. Otters appear not use the whole of their home ranges equally when radio tracked. If they are under greater population pressure they might spend more time in, and exploit more thoroughly, their core areas, at the same time loosening their hold on the sub optimal fringes, so travelling less. If there is one or more road in their range, then they may have to pass it more frequently. Conversely, disruption in the otter population could lead to higher emigration, which again, would result in larger numbers of otters having to cross roads, in order to access new areas.
Data from road casualties is biased due to the method of collection, and this is demonstrated by studies of wild populations caught by other means, such as trapping e.g. Sidorovich (1991). Most studies of dead otters identify roads as being responsible for the greatest number of casualties, although the percentages vary from 42% (Kruuk and Conroy, 1991) to over 80% (Simpson, 2000). Otter carcasses on roads tend to be easily seen (but not for long) and recorded, if not collected. Animals killed by other causes, such as disease, may remain underground, be washed away by currents or tides and so many will not be found and recorded, unless there is a systematic search for carcasses as part of a research program. It is therefore impossible to determine what percentage of otter deaths are caused by roads and what are caused by other causes.
The study of the A75 showed a greater ratio of males, particularly adults, than have been reported in any other study, and this is in a well established, abundant population. The number, but not the proportion, of old adult males and females found during the regular drives were equal, but in the young adult class only males were found. If all animals killed in those twelve months are considered, the difference is more marked, with 45% of males being young adults, but still no young adult females being found. Numbers of adult females were small, but it is notable that 60% of adult females were aged compared with 16% of adult males. The otter’s mating system is thought to be a promiscuous one, being both polyandrous and polygynous and such a system would require fewer males of breeding status than females (Heggberget, 1991). As a result, young independent males need to acquire a higher social status in order to breed and so may be inclined to be less cautious and travel further in order to achieve this. They may also be more inclined to fight and injured animals are at more risk from roads. It could be argued that all road mitigation might achieve is a reduction in the deaths of the least reproductively important part of the population and this could then result in a greater number of otters killed or injured from fighting.
So are road casualties are important in terms of population? The data from the most recent otter survey would imply that the otter population in England is increasing (Crawford 2011). As the otter population appears to be expanding, there must be a greater number of births than deaths (of any cause). In addition, evidence of otters from areas where previously none had been recorded in over 30 years (including some road casualties) would imply that emigration is also occurring. It is interesting to note that there are consistent and increasing high levels of road casualties recorded in Scotland, with no evidence of population effects. So if otters are restricted by road casualties, it is most likely at a local level, where otters are re-colonising and it is here that such losses need to be avoided. Targeted mitigation can be used to ensure that safe passage is available for otters to move to new areas, allowing them to re-colonise their former haunts. Mitigation can also be targeted at locations where clusters of casualties occur, so called “hot spots”. Such hotspots could be the result of particular combinations of engineering and topographical factors and may have less to do with the state of the otter population. This can be demonstrated by the sudden cessation of deaths if the problem is sorted out.
Subsequently, otters have continued to extend their distribution in the UK despite the numbers of road casualties continuing to increase (Chanin 2006) implying that they have yet to have a negative effect on the population. Furthermore, otter carcasses continued to be collected and submitted for post mortems, as part of an ongoing programme investigating heavy metal contamination of the environment. These studies provide a fascinating insight into otter populations, such as the discovery of parasite not before recorded in the UK (Simpson, 2007). Perhaps more important are the numbers of casualties examined from southwest England that showed signs of being bitten by other otters, perhaps indicating that as the density of otters increases, there are more fights between animals (Simpson, 2007). Another study covering most of England and Wales reports that there was a trend towards younger animals in the animals studied (Chadwick, 2007)
In conclusion the evidence appears to suggest that road casualties do not seem to prevent otter populations from expanding although there may well be other effects, such as increased fighting between animals. However all populations have to account for a death toll, and in the absence of predation by any other means, road casualties are one way of limiting otter numbers. This does not mean that mitigation is not required. It should still be encouraged as a conservation tool in areas where otter populations are still low and recovering, and it should be used as a welfare tool to limit the potential injuries to otters and the indirect effects of road casualties, such as orphaned youngsters.
REFERENCES
Andrews E., Howell P., Johnson, K. (1993). Otter Survey of Wales 1991. Vincent Wildlife Trust. London.
Ansorge H, Schipke R & Zinke O (1997). Population structure of the otter, Lutra lutra : Parameters and model for a central European region. Z. Saugetierk 62: 3, 143–151
Bradshaw, A.V., Slater, F.M. (2002). A postmortem study of otters (Lutra lutra) in England and Wales. Environment Agency (Report W1-019/TR). Bristol
Buskirk, S.W., Lindstedt, S.L. (1989). Sex biases in trapped samples of Mustelidae. Journal of Mammalogy. 70: 88-97.
Chadwick. E. (2007) Post mortem study of otters in England and Wales, 1992-2003. Science Report SC010065/SR, Environment Agency, Bristol
Chanin, P. (2006). Otter Road Casualties. Hystrix It. J. Mamm. 17(1) 79-90
Clutton-Brock, T. H., Major, M. and Guiness, F. E. (1985). Population regulation in male and female deer. Journal of Animal Ecology. 54: 831-846.
Conroy, J,W.H., Chanin, P.R.F. (2002). The status of the Eurasian otter (Lutra lutra) In: Dulfer, R,, Conroy, J., Nel J., Gutleb, A.C. (Eds.) Proceedings of the VIIIth International Otter Colloquium March 14-19 1998, held in Trebon, Czech Republic.
Cooch, E.G., Lank, D. B., Rockwell, R. F., and Cooke, F.(1989). Long term decline in fecundity in snow goose populations: Evidence for density dependence. Journal of Animal Ecology. 58: 711-726.
Coxon, K., Chanin, P., Dallas, J. and Sykes, T. (1999). The use of DNA fingerprinting to study the population of Otters (Lutra lutra) in Southern Britain: A Feasibility Study. R&D Technical Report 1999W202. Environment Agency, Bristol.
Crawford, A. (2003). Fourth Otter Survey of England, 2000-2002. Environment Agency (Report W1-061/TR). Bristol.
Crawford, A. (2011) Fifth Otter Survey of England 2009-2010. Environment Agency Bristol
Frank, K., Eulberg,P., Hertweck, K., Henle, K. (2002). A simulation model for assessing otter mortality due to traffic. In: Dulfer, R., Conroy, J., Nel J., Gutleb, A.C. (Eds.) Proceedings of the VIIIth International Otter Colloquium March 14-19 1998, held in Trebon, Czech Republic.
Green, R. (1989). The impact of hunting, poaching and accidents on otter survival and measures to protect individuals. In: Reuther, C., Röchert, R. (Eds.) Habitat 6: 171-190
Green, R., Green, J. (2002). Disease and Health problems in British otters. In: Dulfer, R., Conroy, J., Nel J., Gutleb, A.C. (Eds.) Proceedings of the VIIIth International Otter Colloquium March 14-19 1998, held in Trebon, Czech Republic
Green, R. (2000). Sexual differences in the behaviour of young otters (Lutra lutra). IUCN Otter Spec. Group Bull 17(1): 20-30.
Green, R. (2003). An estimate of the number of otters (Lutra lutra) killed on Scottish Roads. In: Conroy, J.W.H., Gutleb, A.C. and Yoxon, G.M. (Eds) Proceedings of the European Otter Conference, IOSF, Isle of Skye.
Green J., Green R. (1997). Otter survey of Scotland. Vincent Wildlife Trust. London.
Green,J., Green, R., Jefferies, D.J. (1984). A radio tracking survey of otters, Lutra lutra, on a Perthshire river system. Lutra 27: 85-145.
Grogan, A. (2003). Road accidents: are they a significant threat to the survival of the otter? In: Conroy, J.W.H., Gutleb, A.C. and Yoxon, G.M. (Eds) Proceedings of the European Otter Conference, IOSF, Isle of Skye.
Grogan, A., Philcox, C., Macdonald D. (2001). Nature Conservation and Roads: Advice in relation to otters. Wildlife Conservation Research Unit, Oxford.
Harris, S., Morris, P., Wray, S., Yalden, D. (1995) A review of British Mammals. Joint Nature Conservation Committee, Peterborough.
Hauer, S., Ansorge, H., Zinke, O. (2002). Mortality patterns of otters (Lutra lutra) from eastern Germany. Journal of Zoology. 256: 361-368.
Heggberget, T.M. (1988). Reproduction in the female otter in central and northern Norway, J. Mamm. 69: 164-167.
Heggberget, T.M. (1991). Sex and age distribution in Eurasian otters (Lutra lutra) killed by human activity. In: Reuther,C, & Rochert, R. (Eds.) Proceedings of the V Iinternational Otter Colloquium. Habitat 6: 13-125.
Heggberget, T.M., Christensen, H. (1993). Reproductive timing in Eurasian otters on the coast of Norway. Dr. scient. thesis, Department of Zoology, University of Trondheim.
Heggberget, T.M. (2002). Gross anatomy of female reproductive organs in Eurasian otters (Lutra lutra) in different stages of the reproductive cycle. In: Dulfer, R., Conroy, J., Nel J., Gutleb, A.C. (Eds.) Proceedings of the VIIIth International Otter Colloquium March 14-19 1998, held in Trebon, Czech Republic.
Highways Agency (1999). The Good Roads Guide: Nature Conservation and Advice in Relation to Otters. Design Manual for Roads and Bridges. The Stationery Office. London.
Korbel, O. (1994). Hindering otter (Lutra lutra) road kills. Part1. IUCN Otter Spec. Group Bull. 10: 14-20.
Kranz, A., Toman, A., Knollseisen, M., Prasek, V. (2002). Fish ponds in central Europe- a rich but risky habitat for otters. In: Dulfer, R,, Conroy, J., Nel J., Gutleb, A.C. (Eds.) Proceedings of the VIIIth International Otter Colloquium March 14-19 1998, held in Trebon, Czech Republic
Kruuk, H., Conroy, J.W.H. (1991). Mortality of otters (Lutra lutra) in Shetland. Journal of Applied Ecology 28: 83-94.
Kruuk, H., Conroy, J.W.H., Moorhouse, A. (1997). Recruitment to a population of otters (Lutra lutra) in Shetland, in relation to fish abundance. Journal of Applied Ecology, 28: 95-101
Kruuk, H., Jones, C., McLaren, G.W., Gorman, M.L., Conroy, J.W.H. (1997). Changes in age composition in populations of the Eurasian otter (Lutra lutra) in Scotland. Journal of Zoology. 243: 853-857.
Kruuk, H. (1995). Wild Otters, Predation and Populations. O.U.P , Oxford, 290pp.
Madsen, A.B. (1996). Otter (Lutra lutra) mortality in relation to traffic, and experience with newly established fauna passages at existing road bridges. Lutra 39: 76-89
Philcox, C.K., Grogan, A.L., Macdonald, D.W. (1999). Patterns of otter (Lutra lutra) road mortality in Britain. Journal of Applied Ecology, 36 : 748-762.
Reuther, C. (2002). Otters and fyke nets – some aspects whi ch need further attention. IUCN Otter Spec. Group Bull 19 (1): 1-61.
Rosoux, R., Tournebize, T. (1995). Analyse des cause de mortalite chez la loutre d’Europe (Lutra lutra) dans le centre ouest atlantique (France). Cahiers d’Ethologie 15: 337-350.
Scottish Executive (1998-2003). Scottish Transport Statistics, nos 17-24 http://www.scotland.gov.uk/Topics/Statistics/15845/3873
Sidorovich, V.E. (1991). Structure, reproductive status and dynamics of the otter population in Byelorussia. Acta Theorologica, 36: 153-161.
Simpson, V.R. (1998). A Postmortem Study of Otters (Lutra lutra) Found Dead in South West England. Environment Agency (Technical Report W148). Bristol.
Simpson, V.R. (2000). Diseases of otters in Britain. In: Conroy, J.W.H., Gutleb, A.C. and Yoxon, G.M. (Eds) Proceedings of the First Otter Toxicology Conference, IOSF, Isle of Skye.
Simpson. V. (2007) Health status of otters in southern and south west England, 1996-2003. Science Report SC010064/SR1, Environment Agency, Bristol
Sjöåsen, T. (1997). Movements and establishment of reintroduced European otters, Lutra lutra. Journal of Applied Ecology. 34: 1070-1080
Wyllie, I and Newton I. (1991). Demography of an increasing population of sparrow-hawks. Journal of Animal Ecology. 60: 749-766
Yoxon, P. (1997). Otter deaths on the road. International Otter Survival Fund, Broadford. Unpublished Report.
Résumé : Impact du Reseau Routier sur la Loutre
(Lutra lutra)
La Loutre d'Europe (Lutra lutra) a fait un retour spectaculaire et bienvenu dans la plupart des réseaux hydrographiques du Royaume-Uni et ce suite à son déclin dans les années 1950. Cette nouvelle population croissante est aujourd'hui confrontée à diverses menaces d'origine anthropique et l'une d'elles pourrait être le nombre croissant de victimes de la route sur un réseau routier en constante expansion.
Alors que dans ce pays les routes tuent plusieurs dizaines de loutres chaque année, les loutres recolonisent de nouveaux domaines sous-entendant que les victimes de la route n'ont pas d'incidence négative sur la population dans son ensemble. Les victimes sont présumées être très visibles et de nombreuses sont prélevées puis autopsiées. Ces données révèlent beaucoup de choses sur ces loutres alors que certains animaux ne peuvent être examinés ou non prélevés car méconnaissables ou totalement détruits par le trafic routier. De plus, les données de victimes de la circulation routière peuvent contribuer à une meilleure compréhension de la dynamique de la population.
Ce document examine les impacts que ces victimes peuvent avoir sur la population de loutres dans le Royaume-Uni. Ce document a été présenté lors du Symposium sur les routes et les mammifères de la Mammal Society qui s'est tenu à la Société Zoologique de Londres en Novembre 2003.
Revenez au dessus
Resumen: Impactos de las Rutas en las Nutrias Euroasiáticas (Lutra lutra)
La nutria euroasiática (Lutra lutra) ha experimentado una dramática y muy bienvenida recuperación en muchos de los sistemas fluviales en el reino unido, luego de su declinación en la década de los 50s. Esta nueva población de nutrias en expansión, actualmente es vista como bajo amenaza debido a un espectro de causas antropogénicas, y una de tales amenazas podría ser el número creciente de muertes de nutrias en las rutas, que se registra en una red vial en permanente expansión.
Aunque las rutas matan muchas decenas de nutrias por año en éste país, la evidencia de que las nutrias recolonizan nuevas áreas implicaría que las muertes debido a las rutas no afectan negativamente a la población de nutrias como un todo. Es de presumir que las nutrias muertas en las rutas son altamente visibles, y muchas son colectadas y enviadas para examen post mortem. Estos datos revelan mucho acerca de estas nutrias, pero algunos animales puede que no sean examinados, y otros pasados por alto completamente. Debido a que no hayan sido reconocidos, o a la destrucción completa de los restos por el tráfico vial. Más aún, los datos provenientes de muertes en rutas pueden ser engañosos en términos de dinámica poblacional.
Este trabajo discute qué impactos estas mortalidades pueden realmente tener sobre la población de nutrias en el reino unido. Este trabajo fue presentado originalmente en el simposio de la mammal society sobre rutas y mamíferos, llevado a cabo en la zoological society of london en noviembre de 2003.
Vuelva a la tapa